Log
Monitor and debug extension activities through comprehensive logging system that tracks all life-cycle events and operations.
The Log system provides detailed insights into what's happening behind the scenes during form filling, data processing, and automation operations.
🔍 From Browser Console
Access real-time log messages directly from your browser's developer console for immediate debugging and monitoring.
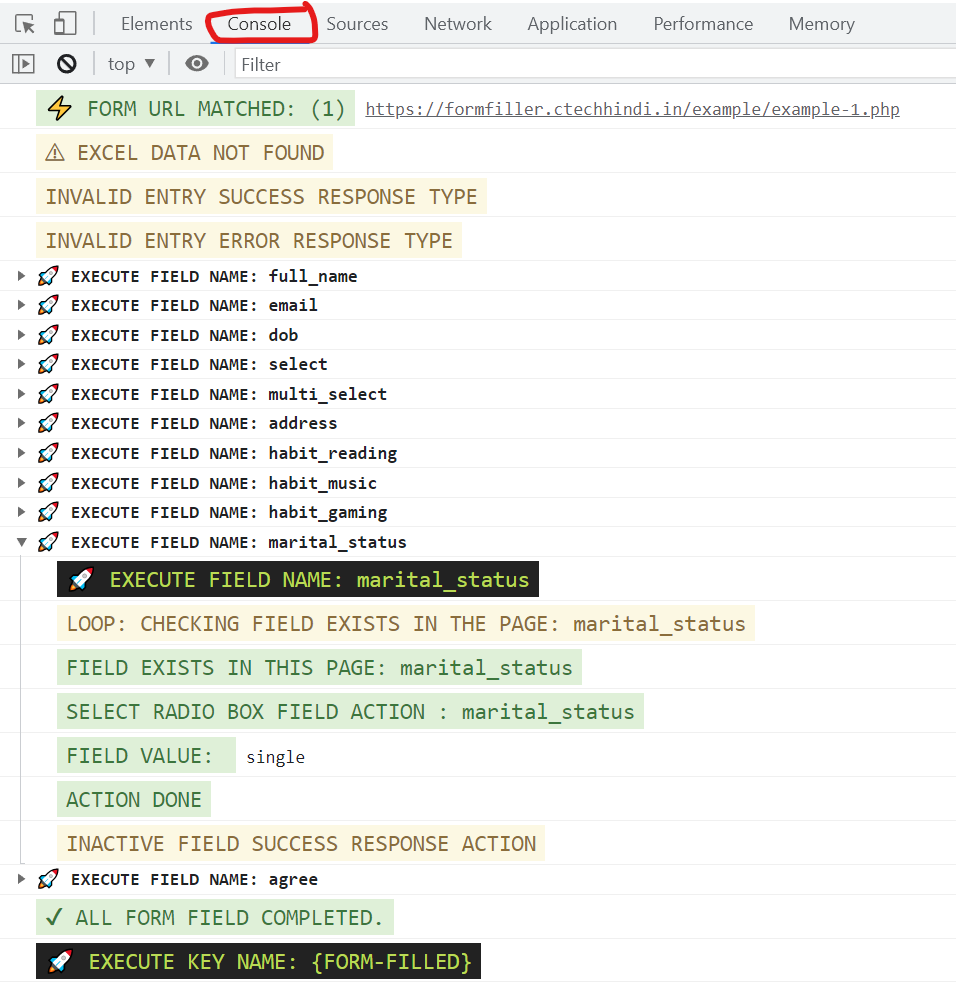
🛠️ How to Open Browser Console
| Platform | Keyboard Shortcut | Alternative Method |
|---|---|---|
| Windows/Linux | Shift + Ctrl + J | Press F12 |
| macOS | Option + ⌘ + J | Press F12 |
| All Platforms | Right-click → Inspect Element | Menu → Developer Tools |
Steps to Access Logs:
- Open browser console using any method above
- Navigate to the Console tab
- Look for messages
📊 Log Message Types
| Log Level | Description | Example |
|---|---|---|
| INFO | General information about extension operations | [EDF] Extension initialized successfully |
| WARN | Warning messages for potential issues | [EDF] Field selector not found, using fallback |
| ERROR | Error messages for failed operations | [EDF] Failed to fill field: input[name="email"] |
| DEBUG | Detailed debugging information | [EDF] Processing form field: #username |
Pro Tip
Keep the browser console open while using the extension to monitor real-time operations and quickly identify any issues during form filling.
📋 Logs Monitor
Access a comprehensive logging interface directly from the extension site page to monitor and track all extension activities in real-time.
Location: Extension Site Page → Logs
Description: The Logs Monitor provides a centralized interface to view, filter, search, and export extension logs with detailed information about each operation.
Features
Log Table Columns:
| Column | Description |
|---|---|
| Time | Timestamp of when the log was created |
| Type | Log level (Success, Info, Warning, Error) |
| URL | The page URL where the log was generated |
| Message | Detailed log message describing the operation |
| Variable | Associated variables or data |
| Actions | Available actions for the log entry |
Available Actions:
| Action | Icon | Description |
|---|---|---|
| Start | ▶ Start | Start logging/monitoring |
| Clear | 🗑 Clear | Clear all current logs |
| Export | 📥 Export | Export logs to file |
Filter Options:
- Success - Show only successful operations
- Info - Show informational messages
- Warning - Show warning messages
- Error - Show error messages
Search: Use the search box to filter logs by message content, URL, or variables.
How to Access Logs Monitor
- Open the extension site page
- Navigate to the Logs tab
- Click Start to begin monitoring
- View real-time logs as they appear
- Use filters to focus on specific log types
- Search for specific messages or URLs
- Export logs for analysis or sharing
Status Bar Logging
Enable in Settings: Settings → Form Filler → Show Extension Logs in Status Bar
When enabled, the latest extension logs will be displayed in the status bar at the bottom of the page (if status bar is active).
Benefits:
- View logs without opening the Logs Monitor
- See real-time updates during automation
- Quick access to latest log messages
- Non-intrusive monitoring
Requirements:
- Status bar must be enabled
- "Show Extension Logs in Status Bar" setting must be turned on
Real-time Monitoring
The Logs Monitor updates in real-time as operations occur. Keep it open during automation to track progress and identify issues immediately.
Note
Log messages in the Logs Monitor are session-based and will be cleared when you close the extension site page. Export important logs before closing.