Logs
Monitor and debug extension activities through a comprehensive logging system that tracks life-cycle events, DOM element matching, and automation operations in real time.


1. Browser Console Window
Access real-time log messages directly from your browser's Developer Tools console for immediate debugging and monitoring during form filling.
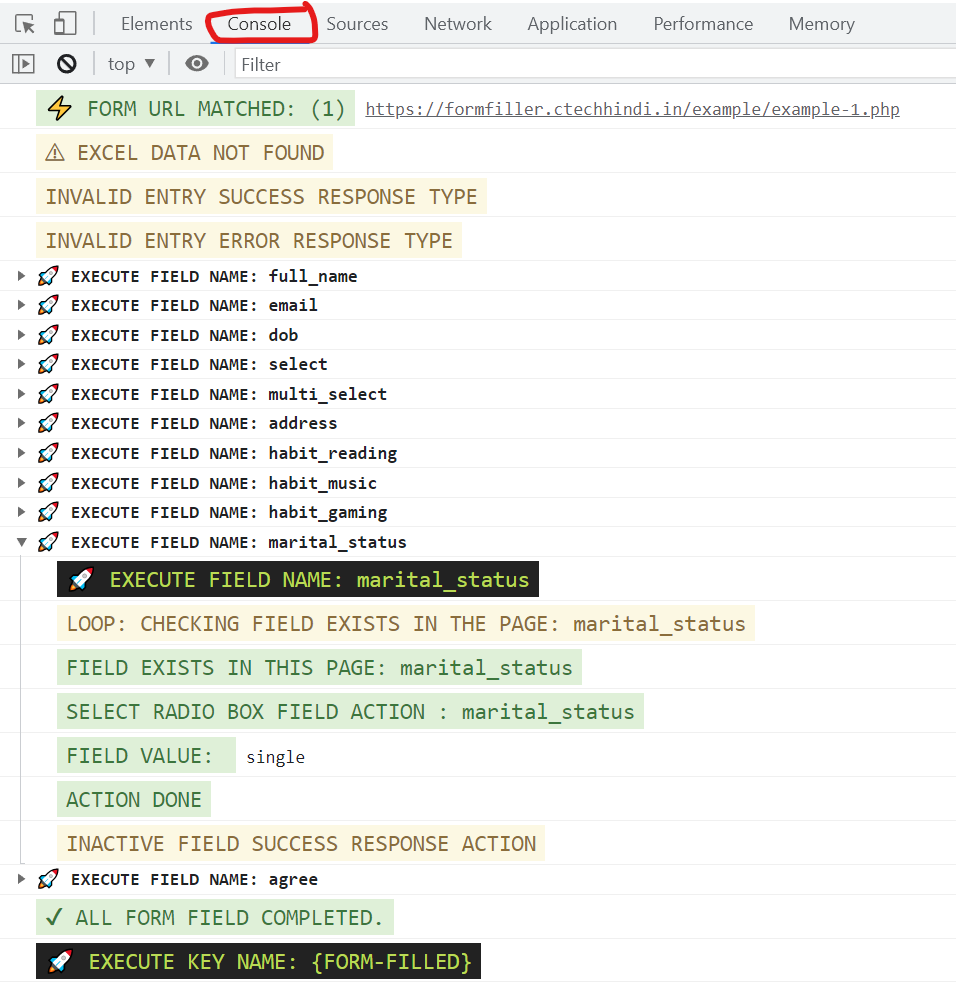
How to Open Browser Console
| Platform | Keyboard Shortcut | Alternative Method |
|---|---|---|
| Windows / Linux | Shift + Ctrl + J or F12 | Right-click → Inspect → Console tab |
| macOS | Option + ⌘ + J or F12 | Right-click → Inspect → Console tab |
Log Message Levels
| Level | Description | Example |
|---|---|---|
| INFO | Normal operation notices and initialization status | Extension initialized successfully |
| SUCCESS | Successful field fills, saves, and completed actions | Data filled successfully: #username |
| WARN | Non-critical warnings, fallback selectors, or skipped conditions | Field selector not found, using fallback |
| ERROR | Failed element matching, network errors, or timeout issues | Failed to fill field: input[name="email"] |
| DEBUG | Detailed element detection and property extraction traces | Processing form field: #username |
Pro Tip
Keep the browser console open while configuring new forms to immediately inspect matching selectors, element values, and execution steps.
2. Extension Logs Viewer
The Extension Logs Viewer is a dedicated slide-over panel and docked sidebar that opens directly over the active web page without needing browser developer tools.
- Full Documentation:
 Settings → Visual Feedback → Show Extension Logs Viewer
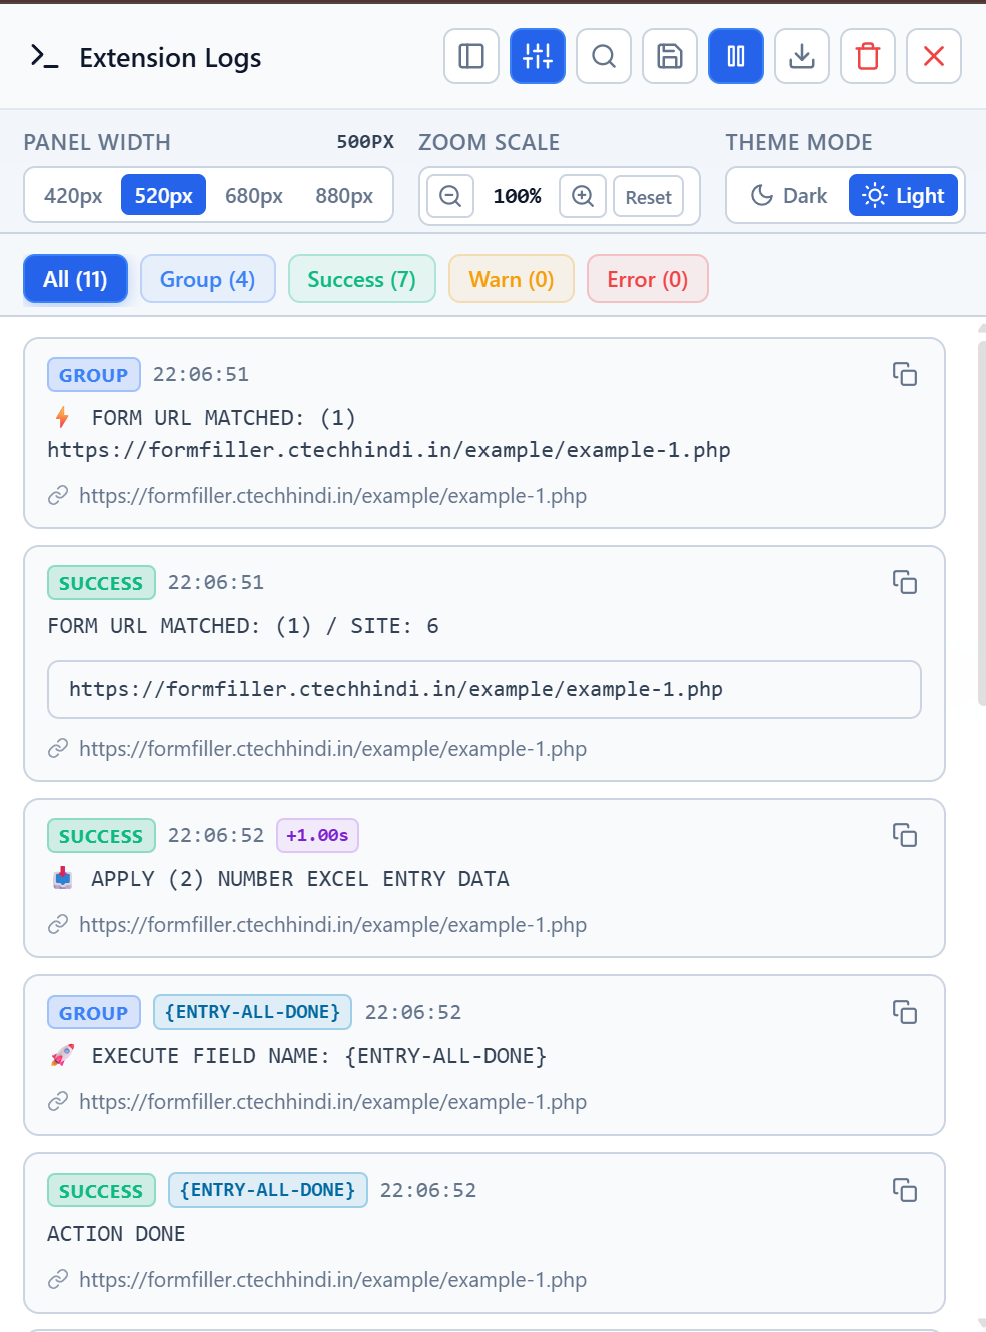
Key Capabilities
- Dock & Floating Modes: Toggle between a floating slide-over drawer and a docked side panel.
- Search Filtering: Filter logs instantly by keyword, selector name, URL, or message text.
- Category Tabs: Filter by All, Group (segments & loops), Success, Warn, or Error.
- Stream Controls: Pause live streaming to freeze and inspect events while automation continues.
- Export Logs: Download current session logs for debugging and offline review.
- Visual Customization: Width presets (420px, 520px, 680px, 880px), zoom scale adjustments, and Light/Dark themes.
3. Automation Status Bar
When enabled, the extension injects a sleek status bar at the top or bottom of the active page that shows real-time progress, entry numbers, and live log updates.
- Full Documentation: Settings → Automation Status Bar & Show Extension Logs in Status Bar

Status Bar Logging Features
- Live Inline Updates: Latest operation and status messages stream right in the bar without covering content.
- Attached Logs Popover: Clicking the logs section on the status bar opens a compact flyout showing recent log entries.
- Lightweight & Non-Intrusive: Monitor progress at a glance without opening developer panels.
- Position & Docking: Place the bar at the top or bottom, or minimize it into a floating dock corner pill.
Dismissing Status Bar Programmatically
If you need to close the status bar during automated tasks (e.g., before taking full-page screenshots), call the closeStatusBar predefined function in your workflow.
Logging from Custom JavaScript
You can also send your own structured log messages from JavaScript Code fields using the $fns.log utility. These messages appear automatically in both the Browser Console and the Extension Logs Viewer:
// Log a success message
await $fns.log.success("Data filled successfully", { row: 1 });

// Log an error message
await $fns.log.error("Submit button not found");

// Log a warning message
await $fns.log.warning("Field skipped due to condition", null);
For more details on custom scripting, see JavaScript Code Field Type.
Related Documentation
- Extension Settings — Configure visual feedback, status bar, and logging options.
- Predefined Functions — Built-in automation helper functions.
 Form Fields Overview — Field configuration and options.